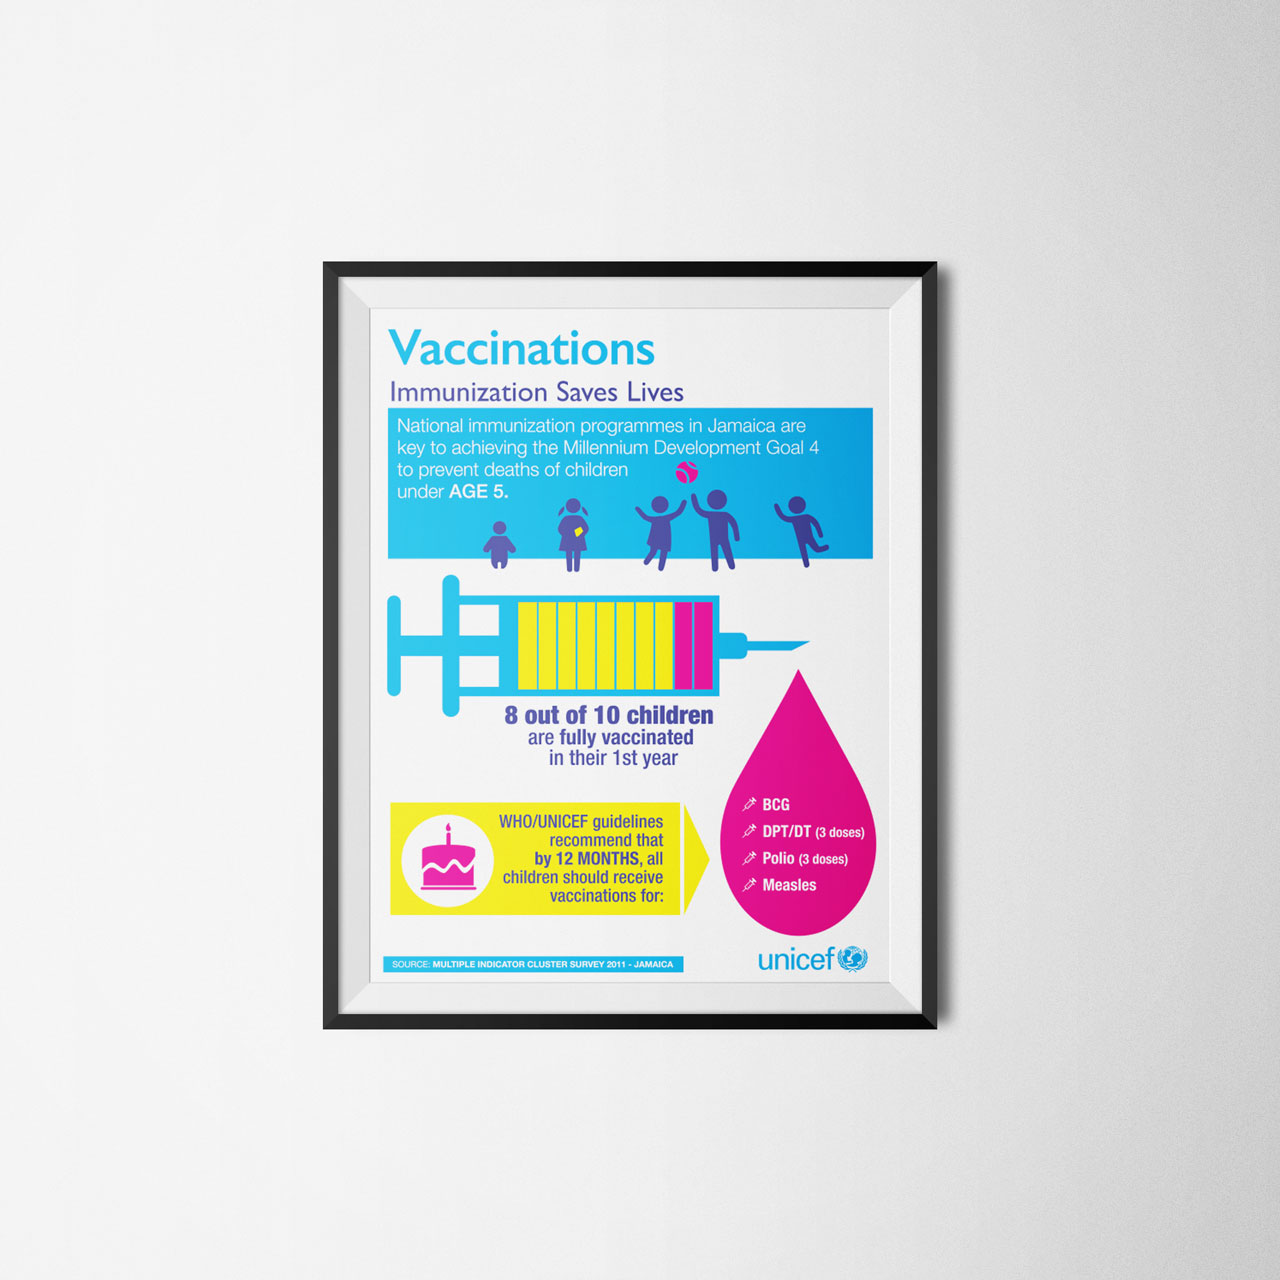
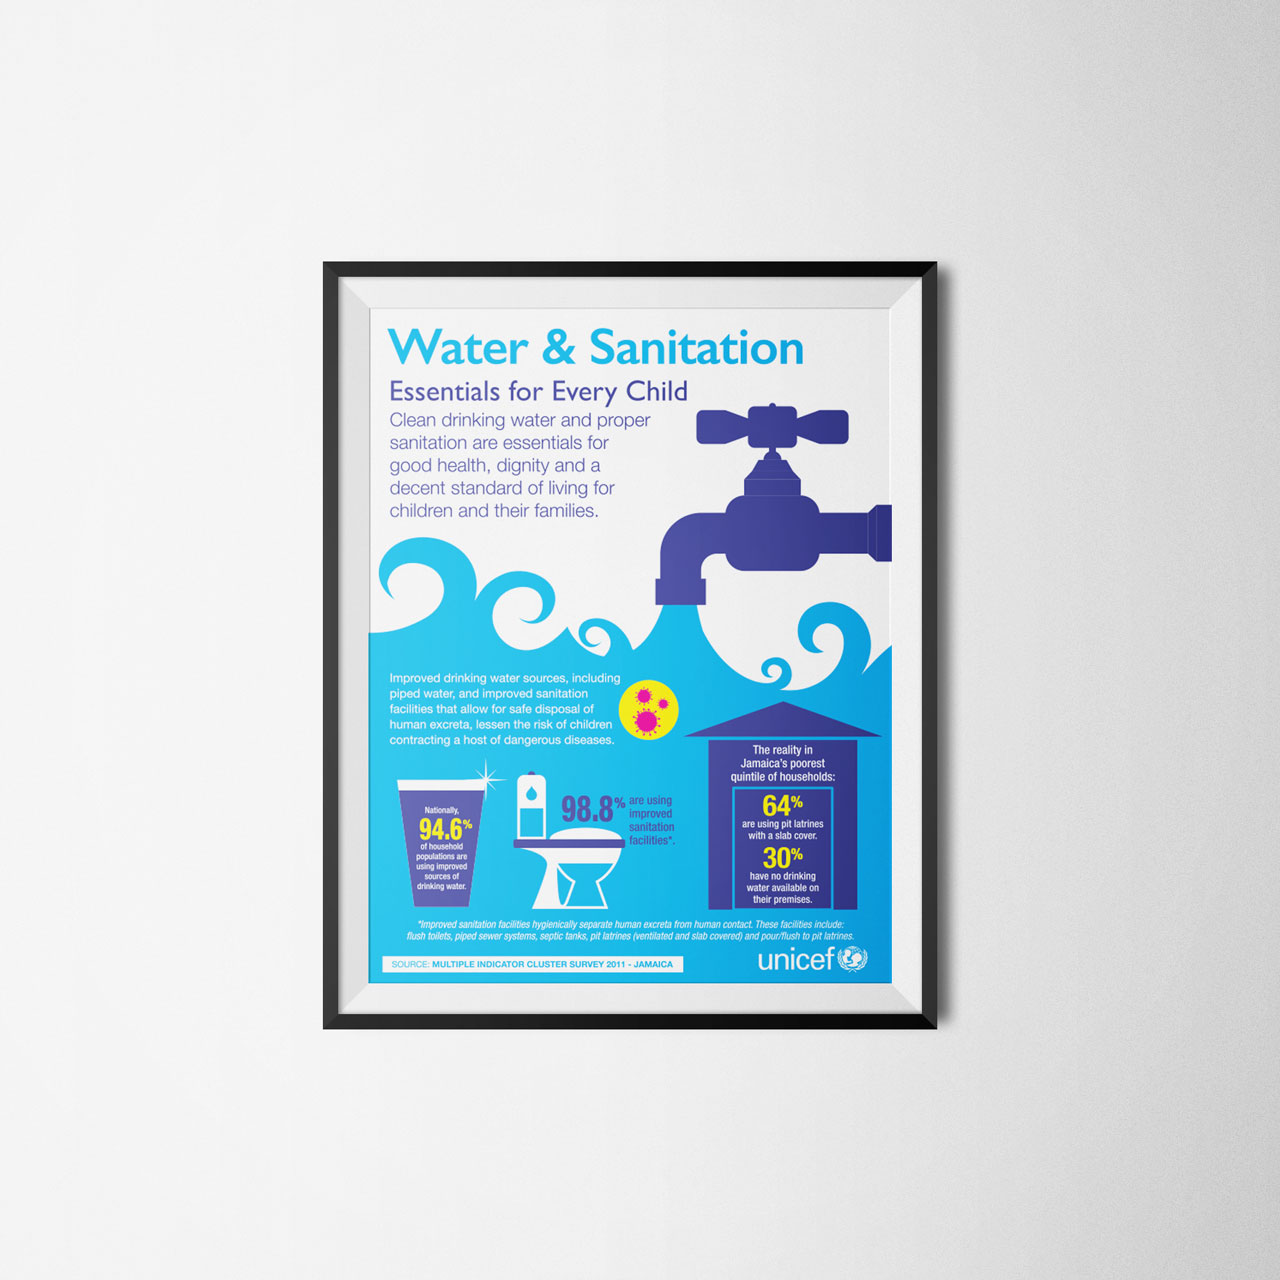
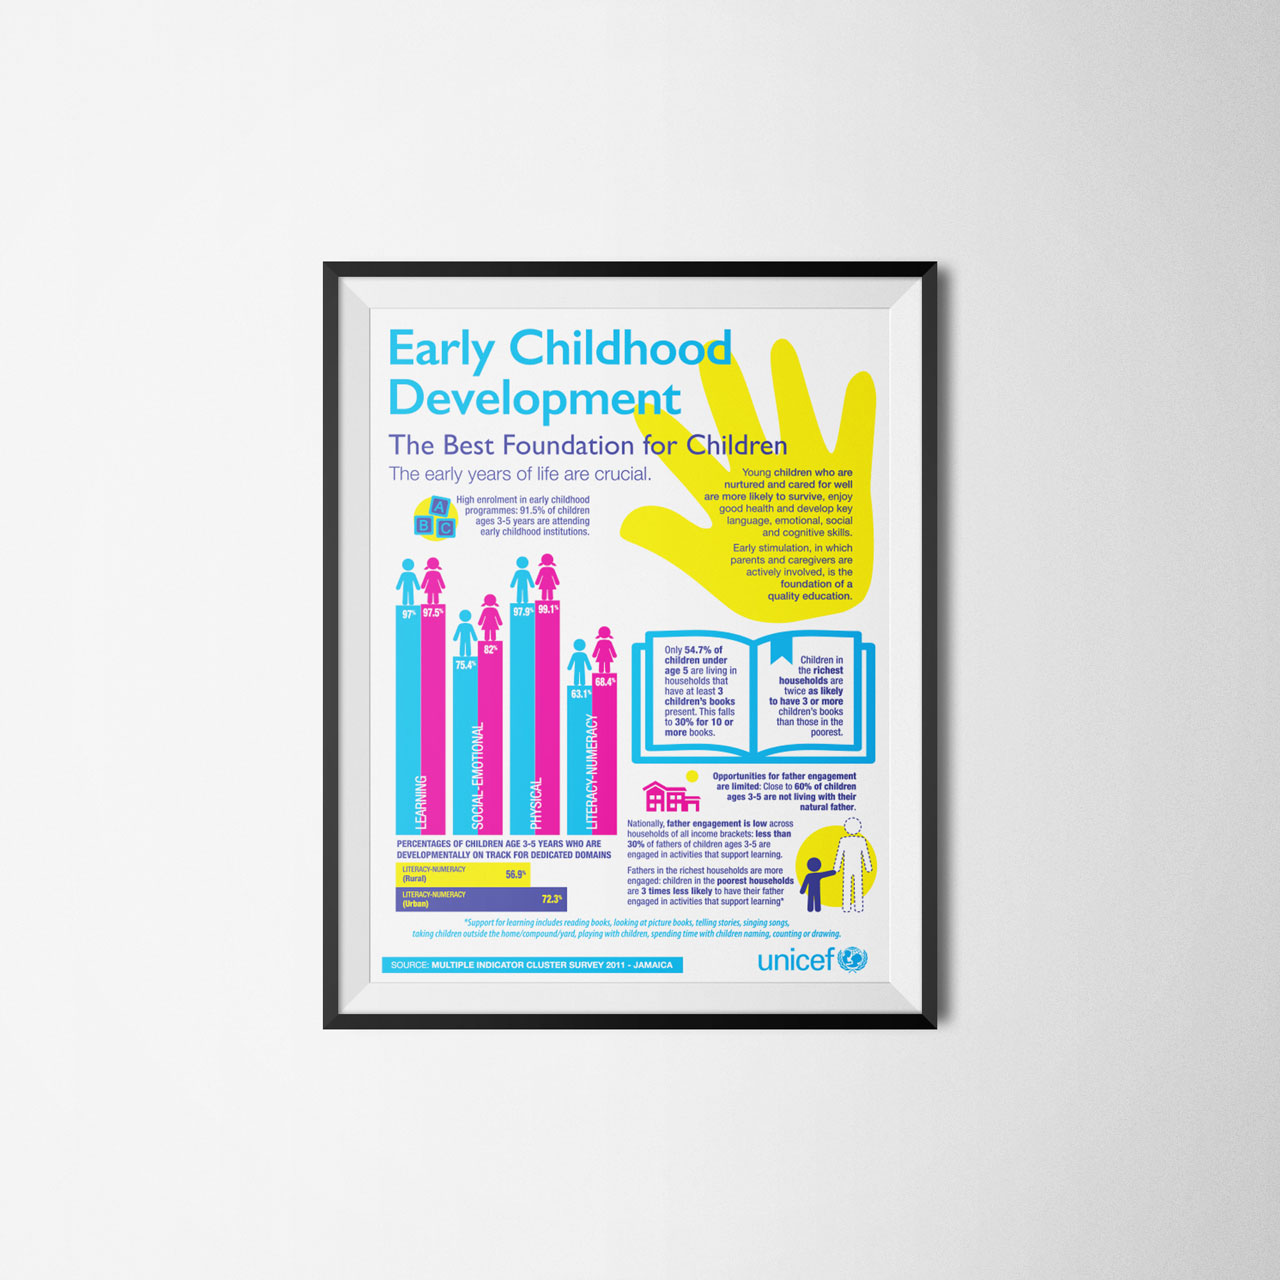
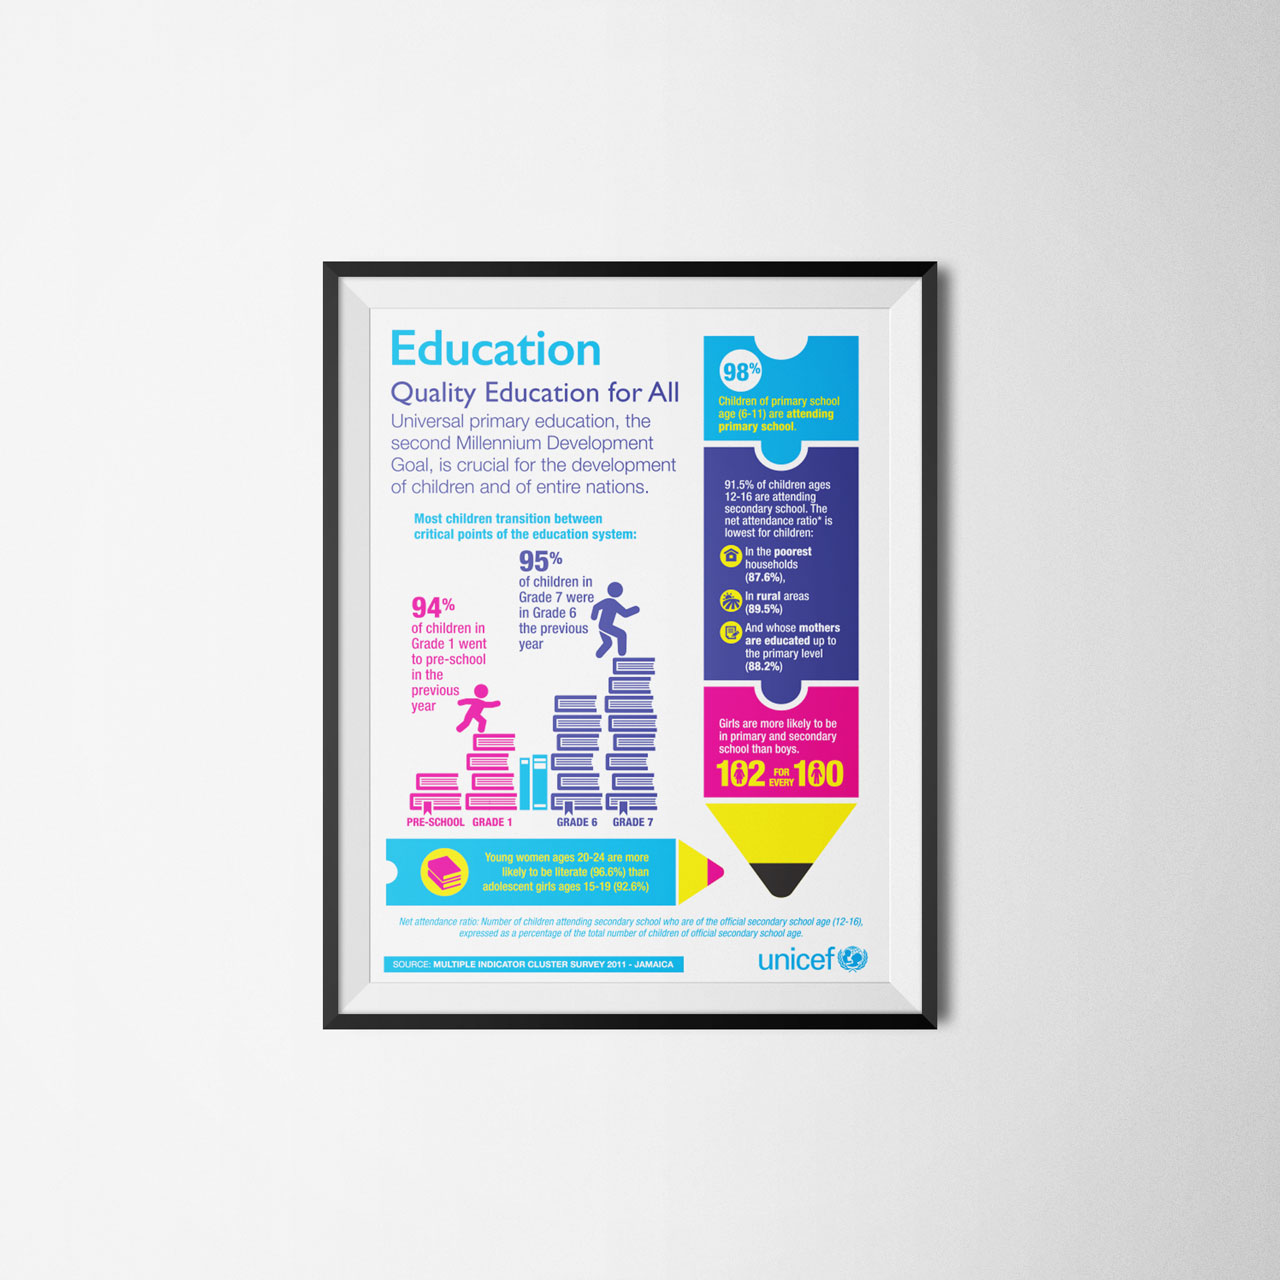
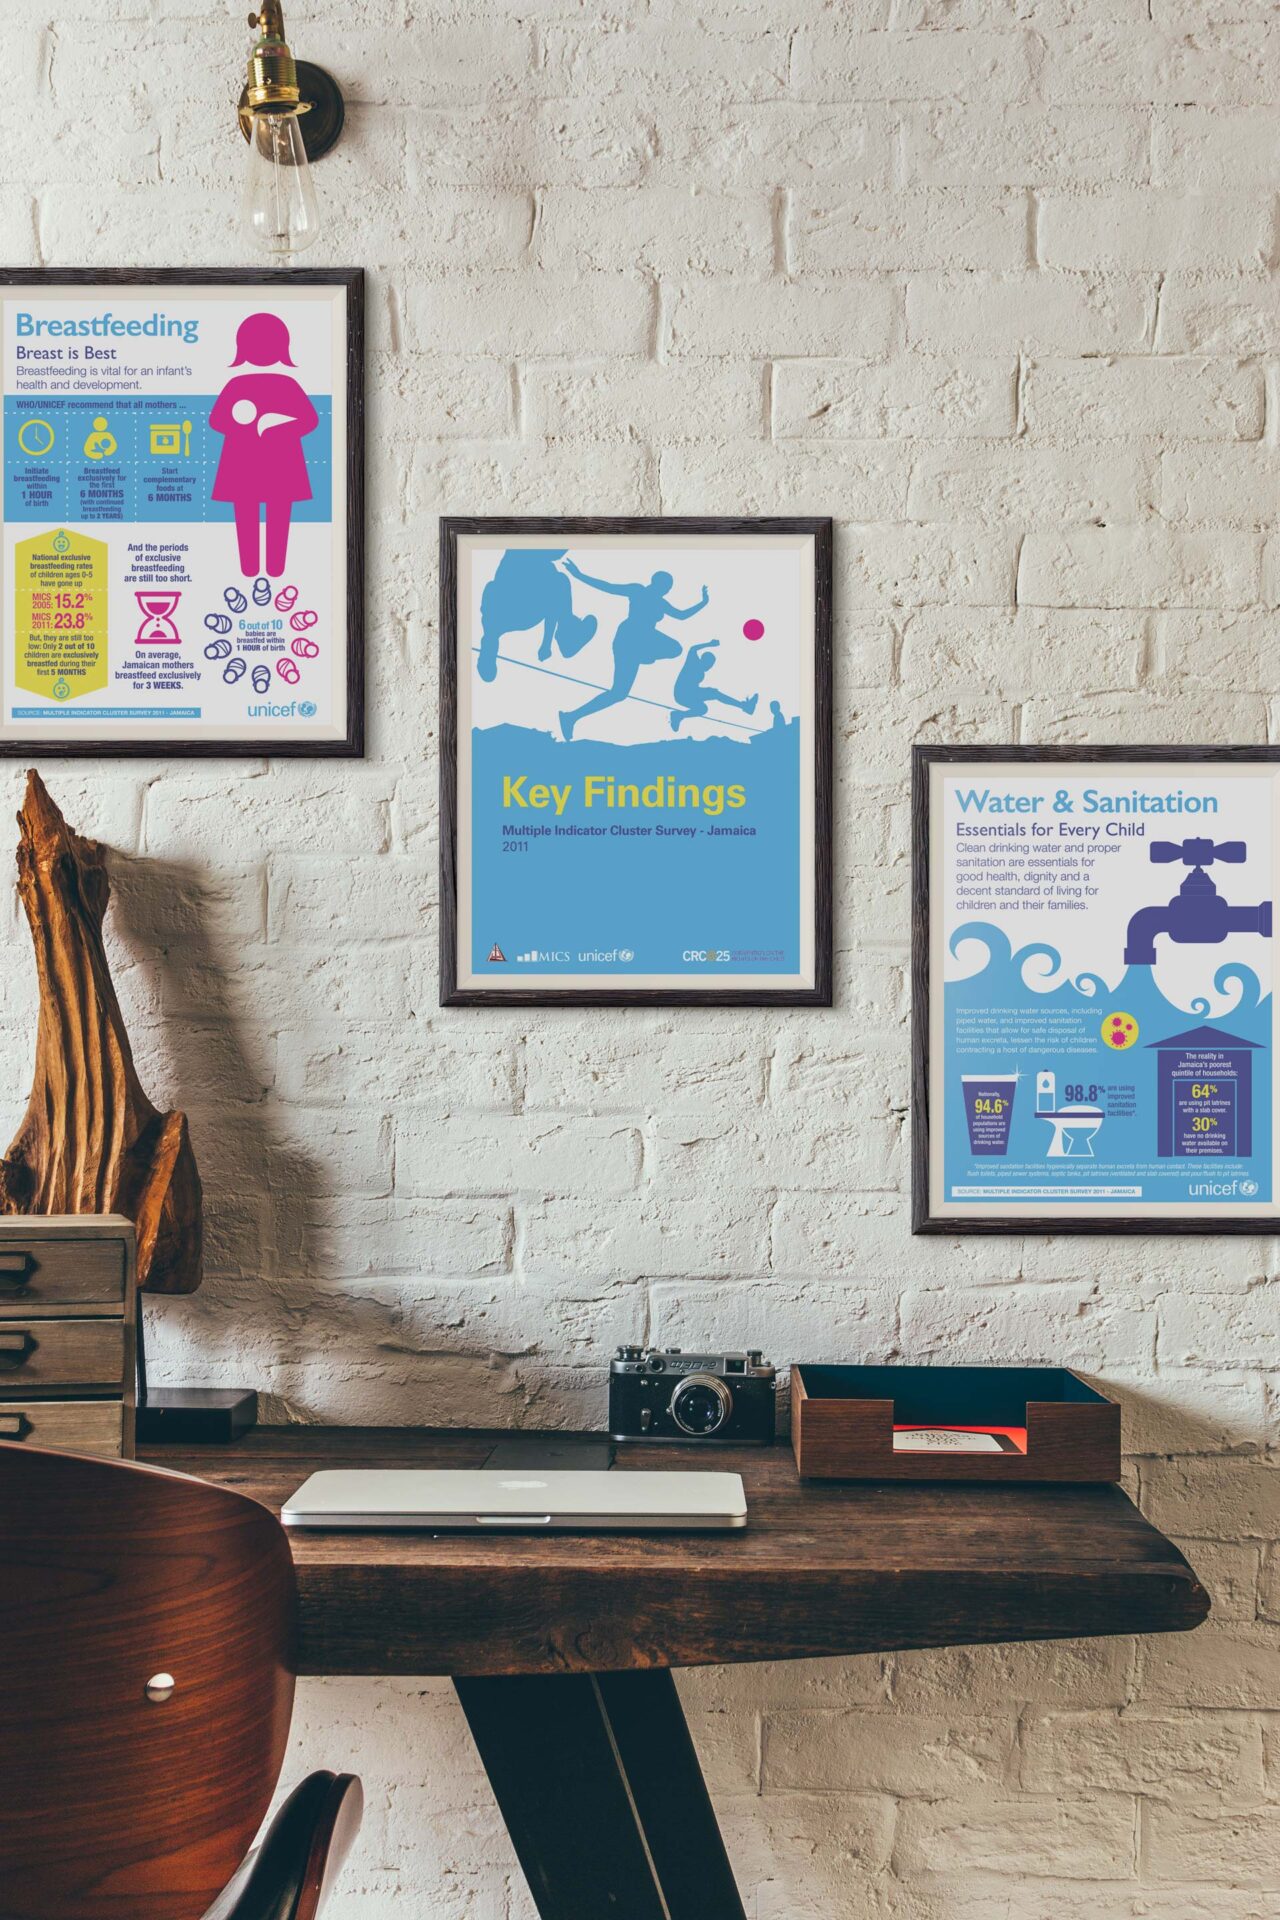
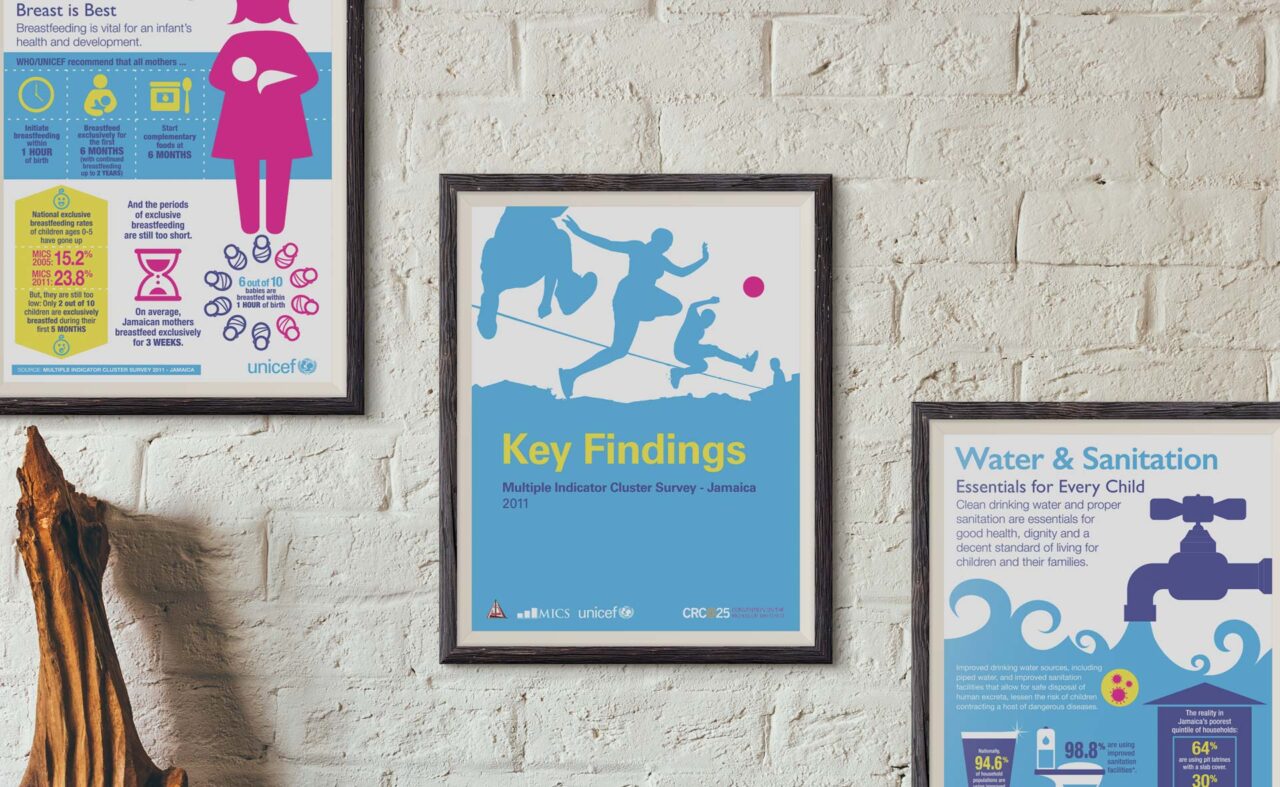
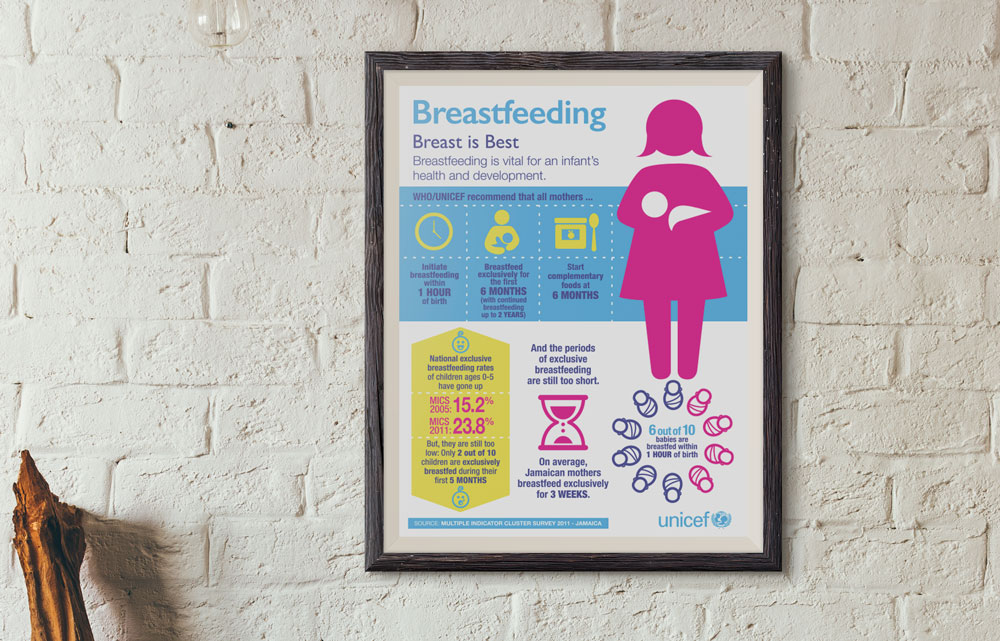
UNICEF sought a way to make the key results of their Multiple Indicator Cluster Study more accessible and engaging. The solution was to transform the report’s key findings into clear and concise infographics. These visuals proved versatile, serving as posters, website banners, and social media content. By presenting the data in a visually appealing format, UNICEF made it easier for a wider audience to understand and engage with the study’s important findings.